Ryan S. Wong’s GitHub Portolio
Welcome to Ryan S. Wong’s Github portfolio page! This is a collection of many of the technical projects that I have been involved with, whether as a gradute student at UC Berkeley or as part of a personal project. Each entry below will have a brief description of the project in question along with any supporting links and documents to go along with them.
About Me
My name is Ryan S. Wong (ColStaR on GitHub), and I am a data engineer and software developer who is working to build his skills and grow his portfolio of work. Having earned my master’s degree in Information and Data Science at UC Berkeley with a specialty in data engineering, I am eager to immerse myself in new data sets with the goal of making the data accessible, optimized, and useful towards addressing real-world problems. I have spent over 5 years in the public education space, but I am eager to explore other industries and data sets, such as medicine, defense, and video games, in addition to working on an expanding number of personal projects.
Table of Contents
- Ryan S. Wong’s GitHub Portolio
Data Science and Analytics Projects
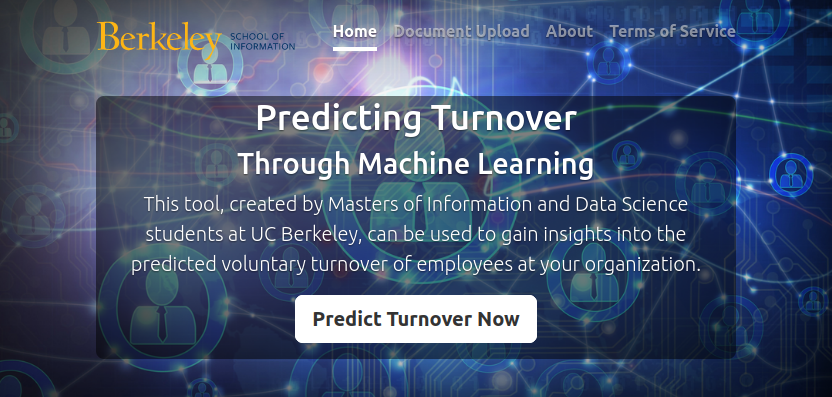
Predicting Turnover through Machine Learning
- Live Web Application: Web App Link
- Web Application Demonstration Video: Web App Demo Video
- Presentation Link: Presentation
- Tools Used:
- Python
- Amazon Web Services (EC2, EKS)
- Jupyter Labs
- Docker
- FlaskAPI
- Web Hosting via Dedicated Server
- Machine Learning Models:
- Logistic Regression
- Random Forest
- Gradient Boosted Trees
- Linear Support Vector Machines
- Nonlinear Support Vector Machines
A publicly-available web application for Human Resources teams that provides machine learning-enabled predictive analytics insights for predicting which employees are at risk of voluntary turnover.
My capstone project for my UC Berkeley MIDS program, I served as project lead for a team of 5 other students as we created a web application that utilizes machine learning to predict employee turnover. Constructed from the ground up, this web application utilizes a custom end-to-end data pipeline that takes in uploaded employee data and provides a dashboard of advanced and actionable analytics; this dashboard includes a time-series chart for historical turnover trends, a chart forecasting turnover rates over time, chi-squared testing for turnover metric significance testing per feature, feature importance tables, and a table of raw data pairing employee data with the machine learning model’s turnover prediction. This 10-week project was entirely self-directed, but assisted with guidance and input from UC Berkeley instructors and the Vice President of Human Resources at Workday, Dylan Gandossy. The Predicting Turnover through Machine Learning project was the culmination of my skills and experience with UC Berkeley’s MIDS program, and the web app that was created can provide tangible value to any human resources team interested in tackling the issue of employee turnover.
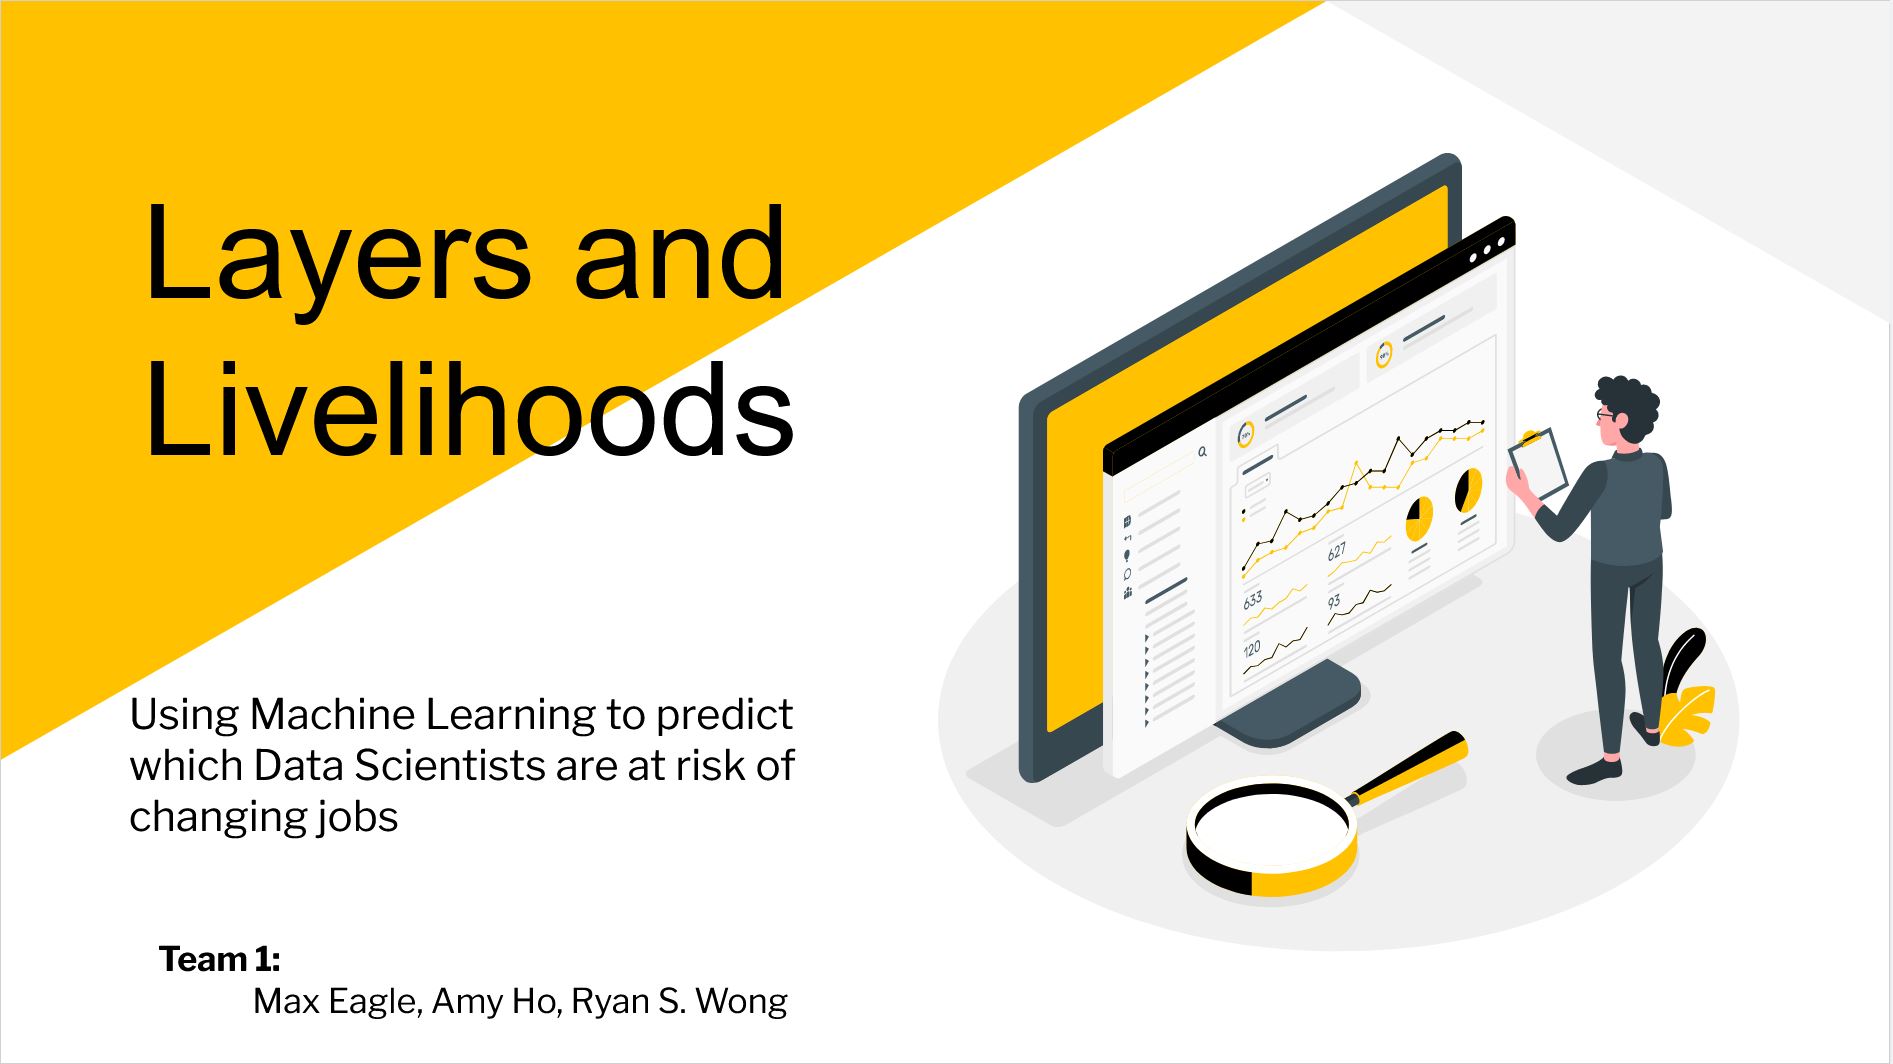
Layers and Livelihoods
- Presentation Link: Presentation
- Tools Used:
- Python
- SciKit Learn
- Tensor Flow
- Machine Learning Models:
- Logistic Regression
- K Nearest Neighbors
- Decision Trees
- Feed Forward Neural Networks
- Linear Support Vector Machines
- Non-Linear Support Vector Machines
- XGBoost
A machine learning project to create and fit a model that would enable corporate HR departments to predict which data scientist employees were actively looking for a different job.
Utilized an HR analytics data set on Kaggle with over 21,000 responses, created a highly automated data pipeline, assessed the effectiveness of 8 different types of models, and successfully created a Non-Linear Support Vector Machine model that could predict employee retention with a 76.5% successful test recall rate.
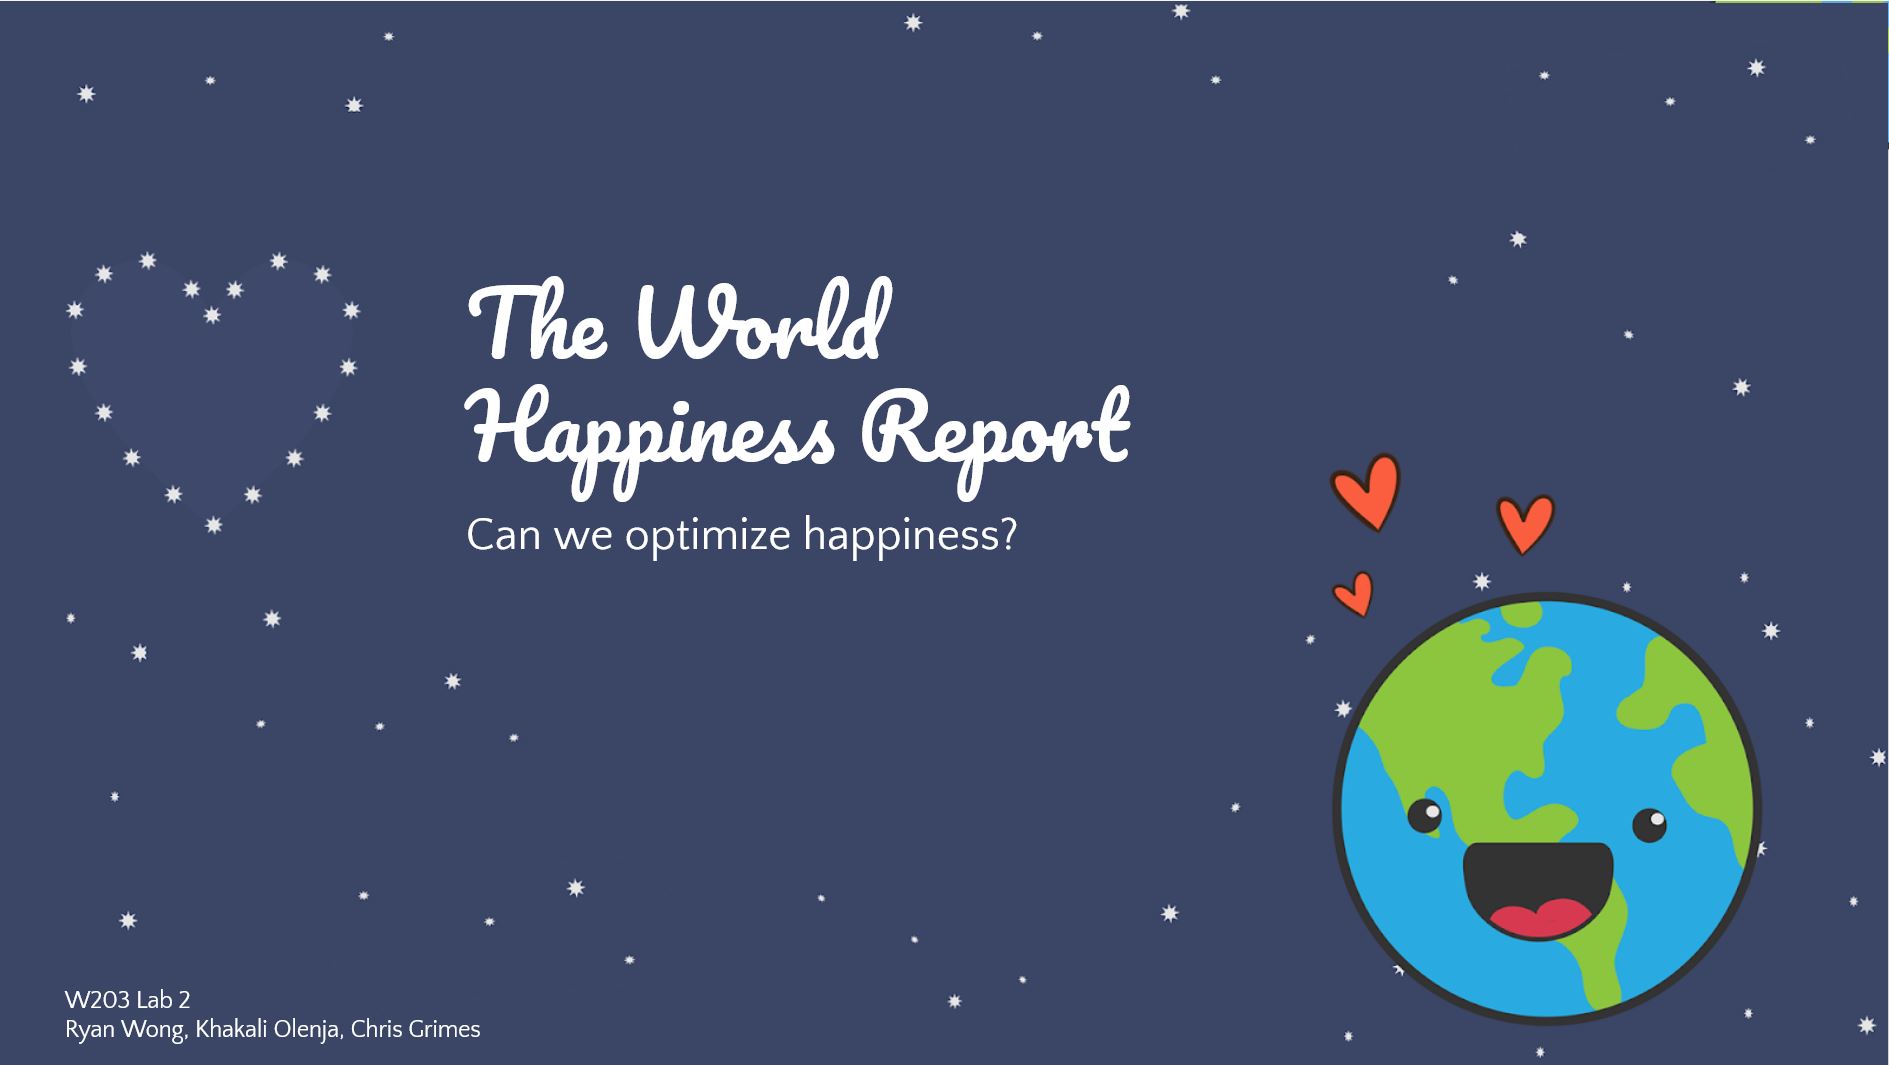
Can We Optimize World Happiness?
- Final Report Link: Report
- Presentation Link: Presentation
- Tools Used:
- R
- Python
A data analytics and statistical prediction project utilizing data from the 2021 World Happiness Reports.
A linear regression model was applied to data from over 149 countries and evaluated with a coefficient T-Test at a 95% confidence level in order to determine whether a county’s wealth had a statistically significant influence in its citizens’ happiness.
Data Engineering and Visualization Projects
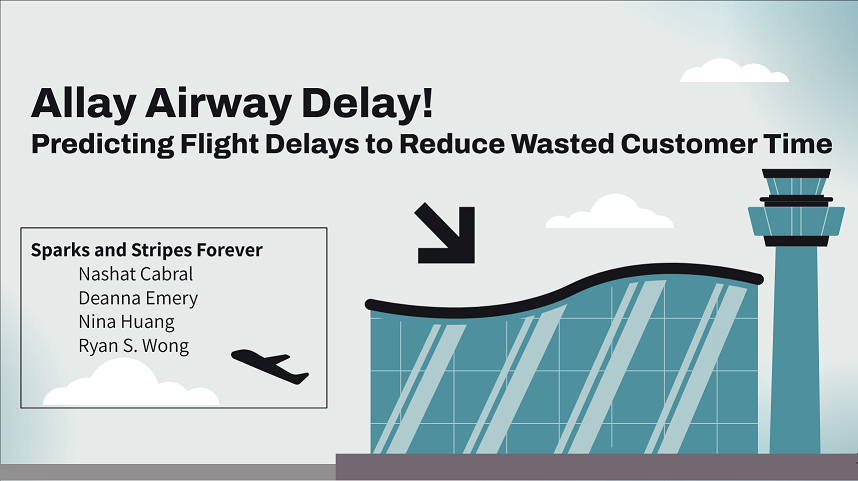
Allay Airway Delays - Creating a Machine Learning Model to Predict Flight Delays
- Research Paper Link: Report
- Presentation Link: Presentation
- Tools Used:
- Apache Spark
- DataBricks
- Microsoft Azure (Cluster Computing and Blob Storage)
- MLLib
- Pandas
A data engineering project utilizing distributed systems that created a data pipeline to train and validate machine learning models on time-series data from 2015-2021 in order to create an optimal model that predicts flight delays for users.
Over 100 GB’s worth of domestic flight and weather data from 2015 - 2021 was cleaned, joined, and transformed with a number of novel and highly predictive engineered features. This data was then leveraged to create a model that most accurately predicted what flights would be delayed by 15 minutes. Due to the size of the data sets in question, a distributed system using Apache Spark on an Azure compute cluster was utilized to complete the computations in a timely manner. Due to the complexities of time series data, sophisticated processes had to be utilized or created from scratch, such as the custom Blocking Time Series Cross Validation method that allowed the distributed systems to cross validate time series data properly.
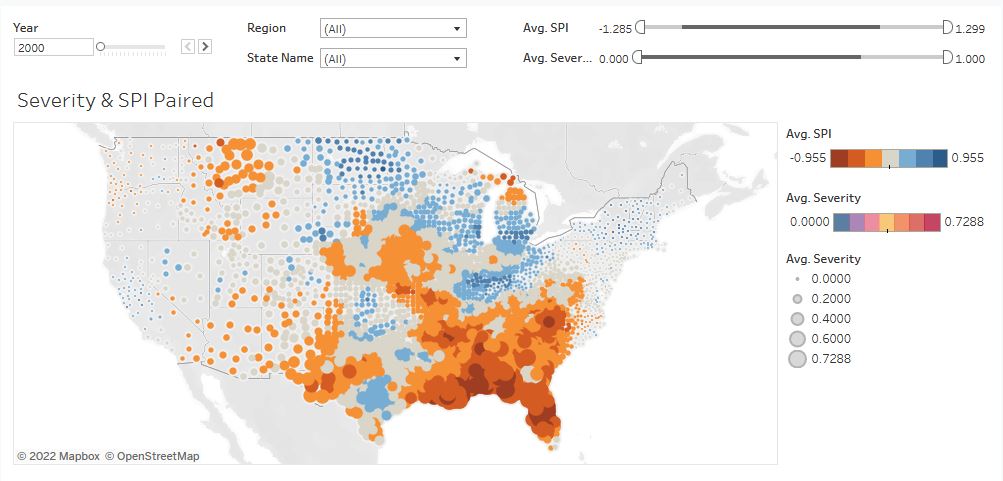
The Water Tables
- Presentation Link: Presentation
- Tools Used:
- Python
- Tableau
- The website created for the project can be found here!
- The visualization can be found here on Tableau Public!
A data engineering and visualization project that combined precipitation and drought data for counties across the United States in order to illustrate trends in climate change from 2000 to 2016.
Drought data from the National Drought Mitigation Center and precipitation data from the Center for Disease Control was combined, cleaned, and feature engineered to create an interactive visualization using Tableau.
Analysis of Crime and Justice in Cook County
- Final Report Link: Report
- Presentation Link: Presentation
- Tools Used:
- Python
- MatPlotLib
A data engineering, visualization, and analysis project that investigated injustice and unfair treatment with criminal sentencing in Cook County, Illinois.
The court sentencing data was analyzed to determine how the demographics of the criminal population differ from that of the civilian population, how severely certain crimes are punished, and how criminals may have been sentenced preferentially light or severely harsh based on their demographics.
Business Strategy for Expanding Acme Gourmet Meals
- Final Report Link: Report
- Presentation Link: Presentation
- Tools Used:
- Python
- PostgreSQL
- Yelp API
- Google Maps API
- NodeJS
- Docker
A data engineering, visualization, and analysis project that plotted and proposed a data-supported business strategy for expanding a hypothetical food company.
Data from Yelp’s API, Google Maps API, municipal BART ridership data combined with NodeJS, and the company’s in-house SQL database was combined and analyzed in order to evaluate possible business strategies, explore potential food delivery methods using real-time technical specifications, and ultimately determine the company’s potential profitability.
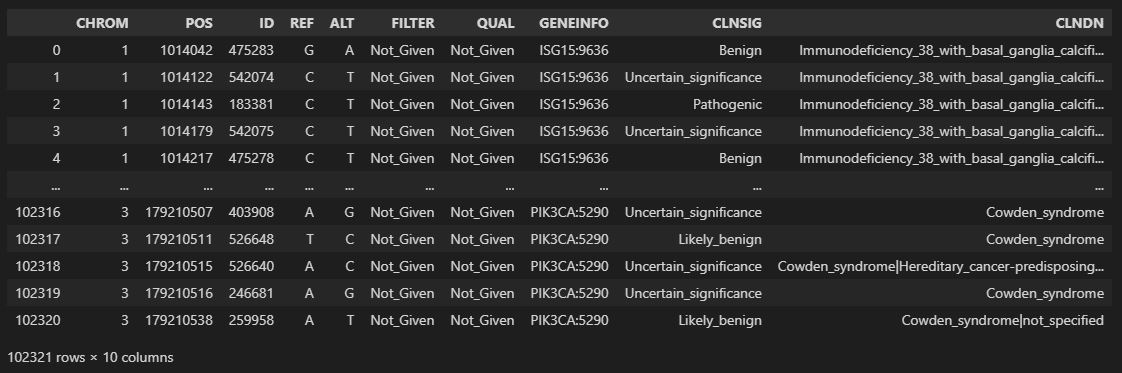
Data Cleaning and Analysis of Pathogenic Genetic Mutations from ClinVar Data
- Tools Used:
- Python
A data engineering and analysis project that utilized the open source ClinVar data set in order to identify pathogenic genetic mutations.
The data had to be injested, cleaned, and analyzed in order to provide evidence-based business suggestions for a hypothetical medical data and technology company. Done as part of our final exam for our Python for Data Science class.
Other Projects
Kosmos
- Tools Used:
- React Native
Worked as a contract front-end software developer for the Fin-Tech startup company Kosmos. Created reusable and reactive web elements for their new wealth and asset management web platform using React Native. The company was acquired in 2022.
Steam Friends Co-Op Game Suggestor
- Tools Used:
- Python
- Steam and SteamFriends API
Created a game suggestion tool that utilized Steam’s SteamFriends API. The program collected and compared the Steam game libraries of two of my friends, appended data of the games we shared to find which games could be played cooperatively together, and suggested a list of games that we could play. This tool allowed us to quickly and easily figure out what Steam games we could play together while hanging out.